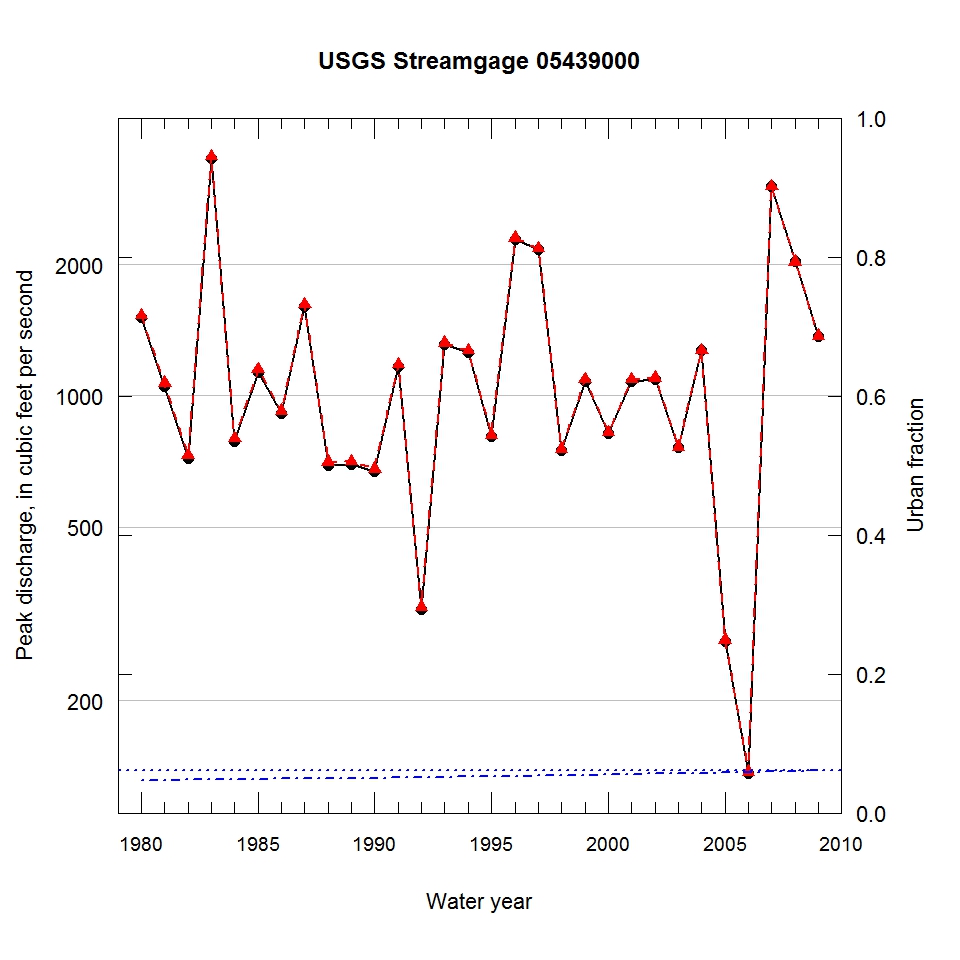
Observed and urbanization-adjusted annual maximum peak discharge and associated urban fraction and precipitation values at USGS streamgage:
05439000 SOUTH BRANCH KISHWAUKEE RIVER AT DEKALB, IL


| Water year | Segment | Discharge code | Cumulative reservoir storage (acre-feet) | Urban fraction | Precipitation (inches) | Observed peak discharge (ft3/s) | Adjusted peak discharge (ft3/s) | Exceedance probability |
| 1980 | 1 | -- | 0 | 0.047 | 1.083 | 1510 | 1530 | 0.179 |
| 1981 | 1 | -- | 0 | 0.047 | 2.171 | 1050 | 1070 | 0.393 |
| 1982 | 1 | -- | 0 | 0.048 | 3.382 | 718 | 730 | 0.655 |
| 1983 | 1 | -- | 0 | 0.048 | 1.905 | 3500 | 3540 | 0.016 |
| 1984 | 1 | -- | 0 | 0.048 | 0.692 | 787 | 799 | 0.604 |
| 1985 | 1 | -- | 0 | 0.049 | 1.348 | 1130 | 1150 | 0.348 |
| 1986 | 1 | -- | 0 | 0.049 | 1.227 | 910 | 923 | 0.495 |
| 1987 | 1 | -- | 0 | 0.049 | 2.132 | 1600 | 1620 | 0.156 |
| 1988 | 1 | -- | 0 | 0.050 | 0.270 | 694 | 704 | 0.675 |
| 1989 | 1 | -- | 0 | 0.050 | 1.244 | 697 | 707 | 0.673 |
| 1990 | 1 | -- | 0 | 0.051 | 0.600 | 671 | 680 | 0.695 |
| 1991 | 1 | -- | 0 | 0.051 | 0.708 | 1170 | 1180 | 0.327 |
| 1992 | 1 | E | 0 | 0.051 | 0.655 | 323 | 328 | 0.925 |
| 1993 | 1 | -- | 0 | 0.052 | 1.022 | 1310 | 1320 | 0.257 |
| 1994 | 1 | -- | 0 | 0.052 | 0.917 | 1260 | 1270 | 0.282 |
| 1995 | 1 | C | 0 | 0.053 | 1.082 | 806 | 814 | 0.591 |
| 1996 | 1 | CD | 0 | 0.053 | 4.560 | 2280 | 2300 | 0.055 |
| 1997 | 1 | C | 0 | 0.054 | 2.242 | 2170 | 2180 | 0.063 |
| 1998 | 1 | C | 0 | 0.054 | 0.984 | 750 | 756 | 0.635 |
| 1999 | 1 | C | 0 | 0.055 | 1.076 | 1080 | 1090 | 0.380 |
| 2000 | 1 | CE | 0 | 0.055 | 1.017 | 818 | 824 | 0.582 |
| 2001 | 1 | C | 0 | 0.056 | 0.703 | 1080 | 1090 | 0.381 |
| 2002 | 1 | C | 0 | 0.056 | 1.761 | 1090 | 1100 | 0.376 |
| 2003 | 1 | CE | 0 | 0.057 | 0.920 | 760 | 764 | 0.629 |
| 2004 | 1 | C | 0 | 0.058 | 1.536 | 1270 | 1270 | 0.280 |
| 2005 | 1 | C | 0 | 0.058 | 0.458 | 273 | 275 | 0.944 |
| 2006 | 1 | CE | 0 | 0.059 | 0.743 | 136 | 137 | 0.987 |
| 2007 | 1 | C | 0 | 0.060 | 3.858 | 3020 | 3020 | 0.023 |
| 2008 | 1 | C | 0 | 0.060 | 5.443 | 2030 | 2030 | 0.076 |
| 2009 | 1 | C | 0 | 0.061 | 1.539 | 1370 | 1370 | 0.235 |

